Key ratios
Group performance indicators
| |
R’000 |
2011 |
|
2010 |
|
2009 |
|
2008 |
|
2007 |
|
| |
REVENUE |
|
|
|
|
|
|
|
|
|
|
| |
Investments and Concessions |
554 659 |
|
591 871 |
|
626 795 |
|
581 685 |
|
533 800 |
|
| |
Infrastructure Concessions |
522 870 |
|
557 227 |
|
527 938 |
|
326 554 |
|
226 016 |
|
| |
Property Developments |
31 789 |
|
34 644 |
|
98 857 |
|
255 131 |
|
307 784 |
|
| |
Manufacturing |
867 523 |
|
866 221 |
|
816 132 |
|
554 656 |
|
523 768 |
|
| |
Construction Materials |
434 233 |
|
491 860 |
|
671 317 |
|
689 220 |
|
231 081 |
|
| |
Construction |
7 350 583 |
|
9 387 636 |
|
9 975 992 |
|
7 074 017 |
|
6 400 519 |
|
| |
Building and Housing |
2 143 004 |
|
3 186 142 |
|
2 899 773 |
|
2 848 795 |
|
3 121 921 |
|
| |
Civil Engineering |
3 548 361 |
|
4 713 487 |
|
4 633 259 |
|
2 964 184 |
|
2 484 293 |
|
| |
Engineering |
1 659 218 |
|
1 488 007 |
|
2 442 960 |
|
1 261 038 |
|
794 305 |
|
| |
|
|
|
|
|
|
|
|
|
|
|
| |
Total revenue |
9 206 998 |
|
11 337 588 |
|
12 090 236 |
|
8 899 578 |
|
7 689 168 |
|
| |
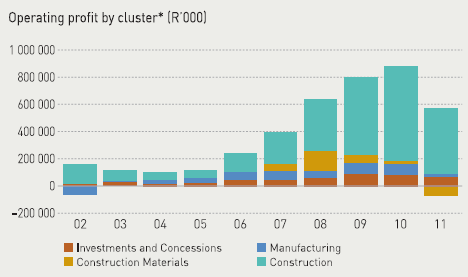
OPERATING PROFIT* |
|
|
|
|
|
|
|
|
|
|
| |
Investments and Concessions |
60 231 |
|
74 926 |
|
81 887 |
|
53 482 |
|
43 091 |
|
| |
Infrastructure Concessions |
73 041 |
|
85 615 |
|
79 636 |
|
30 735 |
|
17 927 |
|
| |
Property Developments |
(12 810) |
|
(10 689) |
|
2 251 |
|
22 747 |
|
25 164 |
|
| |
Manufacturing |
26 187 |
|
86 812 |
|
85 964 |
|
56 211 |
|
66 519 |
|
| |
Construction Materials |
(68 157) |
|
20 186 |
|
55 835 |
|
141 946 |
|
45 531 |
|
| |
Construction |
480 567 |
|
694 971 |
|
573 496 |
|
384 021 |
|
236 483 |
|
| |
Building and Housing |
136 924 |
|
236 620 |
|
141 032 |
|
140 294 |
|
84 276 |
|
| |
Civil Engineering |
232 069 |
|
310 655 |
|
225 733 |
|
142 857 |
|
105 037 |
|
| |
Engineering |
111 574 |
|
147 696 |
|
206 731 |
|
100 870 |
|
47 170 |
|
| |
|
|
|
|
|
|
|
|
|
|
|
| |
Total operating profit |
498 828 |
|
876 895 |
|
797 182 |
|
635 660 |
|
391 624 |
|
| |
Total operating profit margin (%) |
5.4 |
|
7.7 |
|
6.6 |
|
7.1 |
|
5.1 |
|
| |
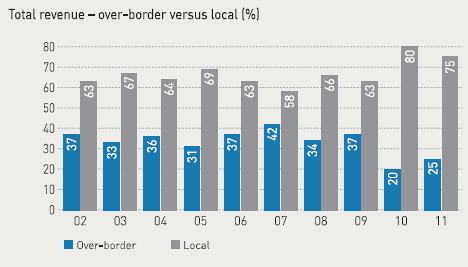
Over-border revenue (%) |
25 |
|
20 |
|
37 |
|
34 |
|
42 |
|
| |
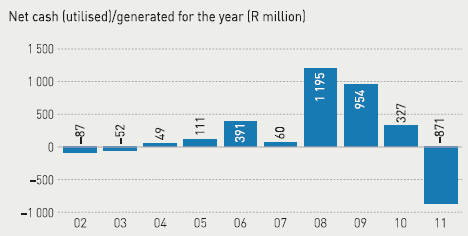
Cash (utilised)/generated – millions |
(871) |
|
327 |
|
954 |
|
1 195 |
|
60 |
|
| |
SHAREHOLDER RETURNS |
|
|
|
|
|
|
|
|
|
|
| |
Earnings per share (R) |
(2,27) |
|
2,80 |
|
5,44 |
|
4,47 |
|
2,91 |
|
| |
Headline earnings per share (R) |
3,32 |
|
6,14 |
|
5,68 |
|
4,70 |
|
2,83 |
|
| |
Earnings per share (R) – before external |
|
|
|
|
|
|
|
|
|
|
| |
BEE ownership expense |
(2,27) |
|
2,80 |
|
5,44 |
|
4,47 |
|
2,91 |
|
| |
Headline earnings per share (R) – before external |
|
|
|
|
|
|
|
|
|
|
| |
BEE ownership expense |
3,32 |
|
6,14 |
|
5,68 |
|
4,70 |
|
2,83 |
|
| |
Dividend per share (cents) |
72,0 |
|
137,0 |
|
130,0 |
|
105,0 |
|
72,0 |
|
| |
Net asset value per share (R) |
22,38 |
|
26,08 |
|
25,09 |
|
21,41 |
|
17,45 |
|
| |
MARKET INDICATORS |
|
|
|
|
|
|
|
|
|
|
| |
Market price – high (R) per share |
41,0 |
|
45,20 |
|
58,25 |
|
73,80 |
|
59,50 |
|
| |
Market price – low (R) per share |
24,4 |
|
31,50 |
|
26,70 |
|
42,00 |
|
27,26 |
|
| |
Market price – year end (R) per share |
29,9 |
|
34,50 |
|
34,70 |
|
44,90 |
|
54,40 |
|
| |
Market capitalisation – year end (R’millions) |
3 632,2 |
|
4 171,5 |
|
4 167,2 |
|
5 350,5 |
|
6 443,5 |
|
| |
Value of shares traded (R’000) |
1 719 970 |
|
2 900 378 |
|
3 612 810 |
|
5 462 078 |
|
3 124 034 |
|
| |
Number traded (’000) |
51 951 |
|
79 130 |
|
92 297 |
|
103 436 |
|
67 728 |
|
| |
R’000 |
2006 |
|
2005 |
|
2004 |
|
2003 |
|
2002 |
|
| |
REVENUE |
|
|
|
|
|
|
|
|
|
|
| |
Investments and Concessions |
316 217 |
|
227 290 |
|
227 355 |
|
170 843 |
|
155 958 |
|
| |
Infrastructure Concessions |
189 247 |
|
132 517 |
|
172 210 |
|
139 575 |
|
124 187 |
|
| |
Property Developments |
126 970 |
|
94 773 |
|
55 145 |
|
31 268 |
|
31 771 |
|
| |
Manufacturing |
472 975 |
|
446 308 |
|
358 296 |
|
320 329 |
|
354 229 |
|
| |
Construction Materials |
– |
|
– |
|
– |
|
– |
|
– |
|
| |
Construction |
5 075 529 |
|
3 834 687 |
|
3 224 266 |
|
3 230 763 |
|
3 203 819 |
|
| |
Building and Housing |
2 788 466 |
|
2 268 610 |
|
1 917 554 |
|
1 433 665 |
|
1 433 000 |
|
| |
Civil Engineering |
1 662 700 |
|
1 051 679 |
|
986 836 |
|
1 290 642 |
|
1 364 000 |
|
| |
Engineering |
624 363 |
|
514 398 |
|
319 876 |
|
506 456 |
|
406 819 |
|
| |
|
|
|
|
|
|
|
|
|
|
|
| |
Total revenue |
5 864 721 |
|
4 508 285 |
|
3 809 917 |
|
3 721 935 |
|
3 714 006 |
|
| |
OPERATING PROFIT* |
|
|
|
|
|
|
|
|
|
|
| |
Investments and Concessions |
37 530 |
|
17 378 |
|
11 358 |
|
23 211 |
|
13 987 |
|
| |
Infrastructure Concessions |
12 398 |
|
6 138 |
|
7 643 |
|
12 565 |
|
12 710 |
|
| |
Property Developments |
25 132 |
|
11 240 |
|
3 715 |
|
10 646 |
|
1 277 |
|
| |
Manufacturing |
60 205 |
|
36 157 |
|
27 969 |
|
6 773 |
|
(63 973) |
|
| |
Construction Materials |
– |
|
– |
|
|
|
|
|
|
|
| |
Construction |
143 064 |
|
62 151 |
|
58 624 |
|
85 178 |
|
144 818 |
|
| |
Building and Housing |
78 903 |
|
44 158 |
|
74 581 |
|
43 760 |
|
60 320 |
|
| |
Civil Engineering |
50 169 |
|
(9 712) |
|
(36 087) |
|
21 475 |
|
55 360 |
|
| |
Engineering |
13 992 |
|
27 705 |
|
20 130 |
|
19 943 |
|
29 138 |
|
| |
|
|
|
|
|
|
|
|
|
|
|
| |
Total operating profit |
240 799 |
|
115 686 |
|
97 951 |
|
115 162 |
|
94 832 |
|
| |
Total operating profit margin (%) |
4.1 |
|
2.6 |
|
2.6 |
|
3.1 |
|
2.6 |
|
| |
Over-border revenue (%) |
37 |
|
31 |
|
36 |
|
33 |
|
37 |
|
| |
Cash (utilised)/generated – millions |
391 |
|
111 |
|
49 |
|
(52) |
|
(87) |
|
| |
SHAREHOLDER RETURNS |
|
|
|
|
|
|
|
|
|
|
| |
Earnings per share (R) |
0,72 |
|
1,82 |
|
1,84 |
|
1,49 |
|
1,16 |
|
| |
Headline earnings per share (R) |
0,69 |
|
1,43 |
|
1,48 |
|
1,20 |
|
0,94 |
|
| |
Earnings per share (R) – before external |
|
|
|
|
|
|
|
|
|
|
| |
BEE ownership expense |
1,95 |
|
1,82 |
|
1,84 |
|
1,49 |
|
1,16 |
|
| |
Headline earnings per share (R) – before external |
|
|
|
|
|
|
|
|
|
|
| |
BEE ownership expense |
1,93 |
|
1,43 |
|
1,48 |
|
1,20 |
|
0,94 |
|
| |
Dividend per share (cents) |
56,0 |
|
49,0 |
|
44,0 |
|
37,0 |
|
31,0 |
|
| |
Net asset value per share (R) |
9,22 |
|
8,30 |
|
7,00 |
|
5,67 |
|
4,56 |
|
| |
MARKET INDICATORS |
|
|
|
|
|
|
|
|
|
|
| |
Market price – high (R) per share |
32,50 |
|
17,00 |
|
11,00 |
|
7,71 |
|
5,25 |
|
| |
Market price – low (R) per share |
15,20 |
|
10,00 |
|
4,95 |
|
3,40 |
|
3,10 |
|
| |
Market price – year end (R) per share |
28,75 |
|
15,39 |
|
11,00 |
|
5,20 |
|
3,40 |
|
| |
Market capitalisation – year end (R’millions) |
2 867,1 |
|
1 132,3 |
|
809,3 |
|
382,6 |
|
250,1 |
|
| |
Value of shares traded (R’000) |
1 373 898 |
|
536 994 |
|
229 924 |
|
199 495 |
|
80 616 |
|
| |
Number traded (’000) |
57 970 |
|
39 950 |
|
28 038 |
|
34 456 |
|
20 751 |
|
* Total operating profit before fair value and impairment adjustments.
|
|
SUSTAINABILITY REPORTING AND ASSURANCE PRINCIPLES
Evaluating our
approach |
 |
Three years ago the group reviewed how it manages key risks and issues of sustainability. During
our evaluation we found that both our management of these issues, as well as the gathering of
information and subsequent reporting were somewhat disconnected from how we were managing
and monitoring our strategy.
We therefore commenced a process of integrating our processes and systems to ensure a holistic
approach to risk and its impact on our business.
As a management team we also debated how risks fitted into our business model and interrogated
whether we truly operate in a sustainable manner. In last year’s report we represented the result
of these discussions – our integrated business model. This is outlined this year on page 4. This
model indicates how sustainability forms a core part of our operations. Our senior management
remuneration is linked to performing against both financial and non-financial measures, further
driving the centrality of sustainability. We also implemented a group scorecard measuring ratios
across people, planet and performance to give an integrated view to the reader of how we perform
across the board. Refer to page 44. |
| |
|
|
Our progression
this year |
|
In a further step towards providing stakeholders with an understanding of our key risks and how we
manage them, this year we increasingly aligned the content of our integrated report with the needs
and interests of stakeholders and with management’s view on our key risks and material issues.
The process we followed is outlined on page 4. In summary, we:
 |
Asked stakeholders what key information they deemed material to the organisation |
|
Identified the material issues in our business through rigorous internal debate at a senior
management and board level |
|
Included external assurance processes of a number of measures |
|
Included key performance measures – these have been provided for a number of years, which
allows careful tracking of our progress. These are not subjective information, but ratios and
percentages which are internally verified by the responsible executive team members |
In terms of external assurance by the auditors who also audit our financial information, we again
chose two sustainability measures most relevant to our business. The measures assured by
PricewaterhouseCoopers were:
|
The group’s construction secured order book |
|
Contract profit/loss-maker ratio |
These measures were chosen as they provide a key insight into the operations of the group and its
sustainability going forward. These measures are also integrally linked to the way the group manages
its future income and the risk of loss-making contracts in its core business of Construction.
We are the first construction group to assure its order book. |
| |
|
|
Focus going
forward |
|
Although the group believes that the risks outlined in our integrated report this year are the
material issues facing the business and that we have assured the areas we believe are most
relevant to our business, in the coming year we need to formalise our assessment processes. This
involves finalising a workplan, led by internal audit and assisted by the CFO. The objective will be to:
|
Confirm the completeness of our key risks identified |
|
Assign responsibility, both internally and externally, for the assurance of these |
|
Ensure all risks are adequately monitored and assured |
This is currently work in progress.
In the next integrated report the group will provide stakeholders with a gap analysis and information
on any further key assurances obtained. |
|
|
The group is independently assured on a variety of ratios each year. In the table below we outline the material ones.
Assurance processes
| |
|
|
|
 |
| Business process assured |
Output from
assurance |
Status |
Assurance provider |
| Operational/risk/financial |
Value of construction works secured
to be executed |
Construction secured
order book confirmation |
Assured |
PricewaterhouseCoopers
Inc. |
Page 52 |
Extent of construction contract
profitability |
Contract profit/loss
maker ratio |
Assured |
PricewaterhouseCoopers
Inc. |
Page 52 |
Fair presentation in all material
aspects – financial position and
performance of the group and
company |
External audit report |
Assured |
PricewaterhouseCoopers
Inc. |
Page 183 |
| Insurance claims |
Insurance claim history
report |
Assured – determined
by external source |
Marsh South Africa |
|
| Internal audit |
Quality review |
Assured – determined
by external source |
Jefferson Wells |
|
| Quality |
| Quality systems |
ISO 9001:2008 |
Assured – 73% of business units
certified |
DEKRA |
|
| Health and safety |
| Disabling injury frequency rate (DIFR) |
Verified DIFR statistics |
Assured – verified statistics |
DEKRA |
|
| Procedures and policies |
DEKRA certification |
Assured – verified procedures |
DEKRA |
|
| Safety systems |
OSHAS 18001:2007 |
Assured – 73% of business units
certified |
DEKRA |
|
| Environment |
| Carbon emissions |
Confirmed carbon
disclosure emission |
Assured for F2010, F2011 being
audited |
Promethium Carbon |
|
| Environmental audits |
ISO 14001:2004 |
Assured – 77% of business units
certified |
DEKRA |
|
| Empowerment |
| BBBEE credentials |
BBBEE scorecard |
Assured |
BEE Verification
Agency cc |
Page 54 |
| Corporate governance |
Evaluation of main board
of directors |
Evaluation report |
Assured via F2011 board
evaluation |
Institute of Directors
Independent service
provider |
|
| Human resources |
| Employee satisfaction |
Employee satisfaction
survey |
Independently verified |
SoftCraft Research |
|
| Training and HR systems |
ISO 9001:2008 |
Assured – audited processes |
DEKRA |
|
|