 |

 |
Print page |  |
Email page |  |
Login | Register |
Operational review from the CFO
The next few pages provide supplementary information to the review from the CFO. We outline the key financial performance of the group, as well as other key issues under the responsibility of the group CFO.
-
Year under review
Financial performance
Overview
Against extremely tough markets conditions, as outlined in the review from the CEO and the operational reviews, the loss attributable to equity shareholders of the group for the year ended 30 June 2011 was R218,1 million (2010: R267,4 million profit). This represents a basic loss per share of 227 cents (2010: earnings per share of 280 cents).
During the year the group processed an impairment of R521,6 million net of tax (2010: R293,1 million net of tax) against the long term carrying value of its property, plant and equipment and goodwill assets relating to its Construction Materials cluster. This represents the most material reconciling item between earnings and headline earnings. The impairment adjustment is discussed below in more detail. A full reconciliation between earnings and headline earnings is presented in note 7 on page 211 of the annual financial statements.
Headline earnings for the year ended 30 June 2011 was therefore R318,9 million (2010: R585,9 million). This represents headline earnings per share of 332 cents
(2010: 614 cents). The fully diluted headline earnings per share for the year ended 30 June 2011 was 315 cents (2010: 561 cents).The financial statements on pages 184 to 255 set out the financial position, results of operations and cash flows for the group for the financial year ended 30 June 2011. Segmental information as approved by the directors relating to the business of the group is set out on pages 192 to 194.
Group revenue decreased by 18.8% from R11,3 billion to R9,2 billion due to a reduction in activity levels within the buildings, housing and civil infrastructure markets, client contract delays and the group’s decision not to chase volume at the expense of margin. These conditions, combined with increasing price competition, resulted in operating profit before fair value adjustments and impairment adjustments decreasing by 43.1% from R877 million to R499 million.
The group operating profit margin was 5.4% (2010: 7.7%). This was attributable to the strong results from the Construction cluster and Infrastructure Concessions, which compensated for the poor performances in Construction Materials and Manufacturing.

The group’s segmental revenue and margin position for the current year and prior financial year are depicted below:
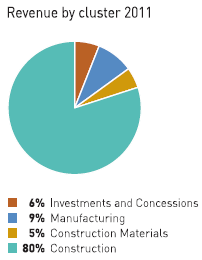
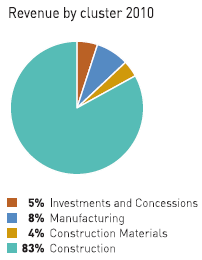
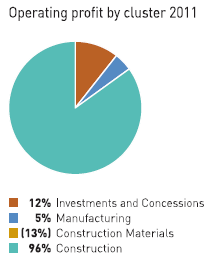

In the interest of transparent disclosure, the group discloses both its total operating margin, as well as its core operating margin. The core margin is the total operating margin net of any non-core transactions, such as pension fund surpluses and deficits, fair value adjustments, etc. The margin excluding these transactions is therefore deemed to be the pure operational margin. The core margin is also reflected within the annual financial statements with the group’s segmental analysis as the executive committee assesses performance of the segments and clusters on this basis.
Operating margin by cluster
Operating margin by cluster % 2011 – total
operating
profit2010 – total
operating
profit2011 – core
operating
profit2010 – core
operating
profitInvestments and Concessions 10.9%12.7% 11.3%12.8% Manufacturing 3.0%10.0% 3.0%9.5% Construction Materials (15.7%)4.1% (15.7%)3.6% Construction 6.5% 7.1% 6.5% 6.9% Total 5.4% 7.7% 5.4% 7.3% Fair value adjustments
 Investment property, investment in service concessions and investment
in property developments are defined as financial assets held at fair
value, with fair value adjustments through profit and loss designated on
initial recognition.
Investment property, investment in service concessions and investment
in property developments are defined as financial assets held at fair
value, with fair value adjustments through profit and loss designated on
initial recognition.Investment in property developments
On 1 November 2008 the group acquired a 15% interest in the Waterfall Development Company (WDC) for R120 million. Through its 22% investment in Atterbury Investment Holdings, WDC holds the development rights for approximately 1,4 million square metres of a new, mainly commercial development to be built between Johannesburg and Midrand (the Waterfall Farm). During the current year, the group disposed of its interest in WDC, which realised a fair value upward adjustment of R13,3 million.
Investment properties
The group’s income-producing investment property was independently valued as at 30 June 2011. In comparing the carrying value to the independent valuation, a fair value downward adjustment of R8,4 million (2010: Rnil) was recorded due to movements in market-related capitalisation rates.
During the year, the group sold its investment in the 114 West contract in Sandton, realising a fair value upward adjustment of R10,8 million (2011: Rnil).
Investment in service concessions
The carrying values of the equity investments in service concessions were assessed. This resulted in upward fair value adjustments of R19,6 million on M6 (Hungary) and R13,5 million on the A1 Phase I and II (Poland) totalling R33,1 million. Refer to page 146 for more details.
Pension accounting
An amount of R2,0 million pension fund deficit (2010: R55,2 million surplus) was recorded against income in F2011 due to the actuarial valuation performed on the group’s defined benefit pension fund as at March 2011. The pension fund is a closed fund. In terms of the fund’s rule amendment, additional surpluses and deficits arising after the legally required surplus valuation date are for the account of the group. The group’s surplus apportionment exercise and rule amendment were approved by the Financial Services Board (FSB). During the prior year, the group completed the outsourcing of its pensioners from the pension fund. The fund therefore exists with only active members. The fund’s overall investment return for the year ended 31 March 2010 was approximately 23% per annum. This was significantly higher than the increase in liabilities for the year, which resulted in a sizeable surplus during the prior year.
Impairment of non-current assets – property, plant and equipment, including intangible mining assets and undeveloped mining resources
Accounting practice requires that the carrying value of non-current assets are reviewed for impairment when there are indicators of impairment. The weakening market conditions applicable to the Construction Materials cluster resulted in detailed impairment tests being conducted.
A lack of clarity on the timing for recovery of construction materials markets, including no visible recovery in the private residential and building sector and a delay in contract roll out and awards in the public sector, required management to apply a prudent consideration to the carrying value of these assets and to process an impairment of R325,6 million in the prior year and a further R550,5 million in the current financial year. Impairment tests performed at year end indicated that no further impairment adjustments are required.
The R550,5 million impairment adjustment includes a R24,9 million goodwill write off relating to the acquisition of the group’s cement extender business in the 2008 financial year.
Finance income – net
In line with expectations, net finance income of R18,4 million was recorded for the year compared to net finance income of R27,9 million in the prior year. This consisted of a positive impact from stable interest rates and a negative impact from the reduction in cash and cash equivalents. This reduction was mainly realised in the first half of the financial year.
Taxation
The effective tax rate of 33%, before the Construction Materials impairment adjustment, was higher than the South African statutory tax rate of 28%. This was mainly due to Secondary Tax on Companies paid, liabilities in jurisdictions with higher taxation rates and a conservative approach adopted in terms of the raising of deferred taxation assets.
Discontinued operations
During the year, an amount of R17,2 million was charged to the income statement mainly as a result of a prudent treatment on the amount due from contract claims and legal costs incurred on a terminated Indian toll road contract. This balance, which was previously reflected under discontinued operations, continues to proceed to arbitration.
The group had to decide whether it was going to increase order in-take at potentially low margin and cash negative returns to cover unutilised assets or whether it would reduce the asset base and focus on margin and cash retention. The group has clearly communicated its strategy of choosing to focus on margins and cash while managing the risk of losing key capacity. 
Cash flow
Operating activities
The group first applies its cash generated from operations to repay debt and taxation commitments, followed by a return to shareholders in the form of dividends. Any remaining cash is used to fund capital investment programmes. This could be debt funded, as the funding strategy is to match funding to asset type.
During the year, we settled an amount of R254,7 million in taxes. In addition, dividends to the value of R121,0 million were paid. The group generated R756,3 million cash from operations before working capital changes. However, although in line with expectations, working capital absorption of R1,2 billion resulted in a net cash outflow of R871,0 million in the period. The material portion of R706,3 million occurred in the first half of the financial year. As expected and outlined to the market, the finalisation of the large local infrastructure contracts saw the unwinding of advance payments and the settlement of creditor final accounts. Pleasingly, working capital outflows were as a result of the settlement of trade and other payables only. It continued to improve in all other areas of trade and other receivables and management of inventory levels.
At year end, the group reported R788,3 million in advance payments on hand (2010: R1,1 billion). In addition, an amount of R266 million cash was held by joint venture partners on behalf of the group. This is therefore not reflected as cash, but as amounts owing by joint venture partners. This balance can be converted to cash. Work under-certified was collected as the balance decreased from R754,5 million at 30 June 2010 to R506,5 million. Refer to the review from the CFO for details on the changes in working capital structure.
Financing activities
The cash effects of financing activities were due to expansion, as explained in the debt and gearing section.
Debt and gearing
We are very pleased to report a fourth year of 0% net gearing due to favourable bank and cash balances on hand. 33% net gearing remains the group’s maximum target, as mandated by the board. Our short term and long term liabilities consist of an unsecured domestic bond, finance leases, property funding and limited bank overdrafts. The debt is mainly variable, linked to JIBAR or prime interest rates. The debt profile matches the assets being funded. Our operating performance reduced the group’s dependency on short term borrowing facilities.
As reported previously, in F2007 the group issued two senior unsecured bonds totalling R850 million which were issued under an approved R1 billion listed debt management programme. The first instalment was repayable in February 2010, with the second due in February 2012. Management has considered the bullet repayments in the forward looking three-year cash and profit forecasts. In the prior year, the group settled the GFC 1 bond dated 27 February 2010 for R300 million in cash. Refinancing of these bonds in future may be considered where opportunities for investment are identified.
During the year, our capital investment programmes were reviewed and budgets reduced in light of weak market conditions. Any increase in debt is as a result of a requirement in capital equipment to accommodate specific requirements on recently awarded construction and contract crushing contracts or replacement of capital equipment required.

The Global Credit Rating
agency (GCR) awarded the
group a long term credit
rating of A and a short term
credit rating of A1.Investing activities
All existing capital investment projects are required to provide a targeted return in excess of current weighted average cost of capital (WACC), which was 12.80% during the year. This rate of return is applied to all existing projects. New projects are assessed on WACC based on the cost of new capital. The central treasury funds all capital projects, which are executed by wholly owned subsidiaries. The central treasury funding requirements are raised from local debt markets and take into account the group’s self-imposed net gearing ratio of a maximum of 33%.
Acquisitions and disposals
There were no business combinations during the current financial year.
-
Issued stated capital and share trading
Share trading
Our JSE-listed share trading activity (share code: GRF) decreased during the year, with levels returning to those of F2006. 52 million shares (2010: 79 million) traded in the year, representing a value traded of approximately R1,7 billion (2010: R2,9 billion) at an average price of R33 per share (2010: R36). Our market capitalisation at year end was
R3,6 billion (2010: R4,2 billion). The percentage of shares held by South African residents was 86%, an increase from the 82% in the prior year.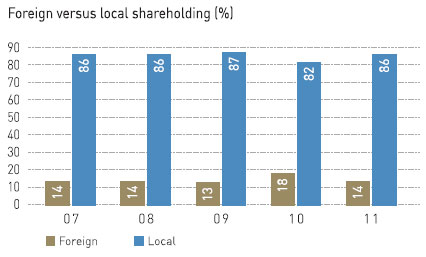 Dividends
The group’s adopted dividend policy is approximately four times basic earnings per share dividend cover. This policy is subject to review on a semi-annual basis, prior to dividend declaration, as distributions are influenced by business growth, acquisition activity or movements in earnings as a result of fair value accounting adjustments.
In recognition of the non-cash nature of the Construction Materials impairment adjustment, the board approved a dividend based on a cover of four times earnings per share of R2,89 before recording impairment adjustments and pension fund deficits and non-cash fair value adjustments. A final dividend of 20 cents per share (2010: 74 cents) has been declared. This brings the total dividend for the year to 72 cents per share (2010: 137 cents).
Future reduction in issued stated capital
In prior years, shareholders were informed that one of the group’s broad-based black economic empowerment (BBBEE) shareholders iLima had not fulfilled certain conditions and/or breached certain terms to which the original ownership transaction was subject to. As a consequence, the iLima portion of the transaction will unwind. This will result in the return of the group’s shares held by iLima. The issued stated capital of the group will reduce once the shares are returned and cancelled.
The group’s direct and indirect exposure to iLima remains R172 million. The exposure will ultimately be recouped against the value of the returned shares. There was therefore no financial effect on the current and prior year’s earnings of the group.
There was also no material effect on the basic weighted average number of shares in issue. However, the fully diluted weighted average number of shares in issue will reduce post year end on return of the shares as no future dilution will be incurred relating to this transaction. At year end, the fully diluted number of shares included 1,9 million dilution shares relating to the iLima Consortium.
-
Effect of significant changes in accounting policies
The group completed a technical review of all statements and interpretations which became effective for the period under review. The full list, as well as their effect on the reported results, is discussed on pages 206 to 208. The accounting effect of the Discussion Paper on Revenue Recognition, as discussed in the prior period, will have a significant impact in future reporting periods.
-
Conclusion
The group continues to be strategically well positioned in active market sectors. The Construction one-year order book as at 30 June 2011 stands at R5,9 billion (2010: R7,1 billion). The group’s total secured Construction order book stands at R8,8 billion (2010: R9,2 billion).