 |
|
||||||||


|
This spread outlines the key financial impacts during the year to provide effective context to this year’s results. This spread should be read in conjunction with the review from the CFO on page 80 and the audited annual financial statements available in the online section of the report at www.groupfive.co.za. |
 |
Unpacking the accounting disclosures on the discontinuance of the Construction Materials cluster |
Based on the group’s operational and strategic focus, as well as the poor outlook for the construction market in the South Gauteng region, the board of directors of the group resolved in December 2011 to dispose of the businesses that constitute the Construction Materials cluster. We believe it would have been even more costly for shareholders to wait for a market recovery before exiting the business.
Accounting practice thus requires that:
|
||
|

During the current year, the group incurred a further two additional impairments relating to:
|
||
|
Operating losses are not adjustable for headline earnings and impairments are adjustable in the determination of headline earnings.
To unpack the financial effects of this change in disclosure, a summary of the reconciliation of earnings to headline earnings for both the current and prior year is set out below. The previously reported results for F2011 has also been included to assist the user with comparison.
| R’000 | Audited 2012 |
Audited Restated 2011 |
Audited Previously reported 2011 |
|||||
| Attributable loss | (278 405) | (218 107) | (218 107) | |||||
| Adjusted for (net of tax) | 389 982 | 531 695 | 536 989 | |||||
| Loss on sale of property, plant and equipment | 3 675 | 832 | 832 | |||||
| (Profit)/loss on disposal of subsidiary | (36) | 574 | 832 | |||||
| Impairment of property, plant and equipment | – | 521 621 | 574 | |||||
| Net profit on fair value adjustment on investment property | (7 720) | (3 252) | (3 252) | |||||
| Impairment of, and costs associated with, discontinued India contract claim | – | – | 17 214 | |||||
| Impairment of non-current assets classified as held for sale | 394 063 | 11 920 | – | |||||
| Headline earnings | 111 577 | 313 588 | 318 882 |
Disclosure is also provided on the breakdown of the loss from discontinued operations for both the current and prior year.
| R’000 | Audited 2012 |
Audited Restated 2011 |
Audited Previously reported 2011 |
|||||
| Impairment of, and costs associated with, discontinued India contract claim – net of tax | 60 660 | 17 214 | 17 214 | |||||
| Construction Materials operating losses – net of tax | 52 787 | 54 770 | – | |||||
| Profit on sale of Construction Materials businesses | (1 436) | – | – | |||||
| Construction Materials impairment – net of tax | 340 830 | 521 621 | – | |||||
| Total | 452 841 | 593 605 | 17 214 |
 |
Financial update on Construction Materials The group invested in the Construction Materials businesses which comprise sand and aggregates, readymix and extenders and mining crushing services during F2007, with a few smaller acquisitions in F2008. This acquisition was concluded at the top of the construction cycle. The table below discloses the value of these acquisitions. |
| Rm | Total | Quarry Cats & Afrimix |
Sky Sands | Bernoberg | BGM | |||||||
| Acquisition date | February 2007 | July 2007 | October 2007 | July 2008 | ||||||||
| PPE* | 208 | 166 | 29 | 6 | 7 | |||||||
| Mining assets and undeveloped mining resources | 1 052 | 821 | 159 | – | 72 | |||||||
| Goodwill | 25 | – | – | 25 | – | |||||||
| Cash | 14 | 19 | 3 | (7) | (1) | |||||||
| Net (liability)/asset | (256) | (196) | (54) | 1 | (7) | |||||||
| Net purchase price | 1 043 | 810 | 137 | 25 | 71 | |||||||
| Cash | (14) | (19) | (3) | 7 | 1 | |||||||
| Purchase consideration | 1 029 | 791 | 134 | 32 | 72 |
| * | Property, plant and equipment. |
| Since F2008 there have been cyclical shifts in the aggregates and readymix markets. Independent research confirms that this is the worst downturn in decades. This resulted in the two impairments in prior reporting periods to the carrying value of the assets, as the businesses were valued based on a discounted cash flow of future income streams. The level of clarity of infrastructure spend in the Gauteng region – where the assets are based – was not sufficient to justify the carrying value of the assets. |
The two impairments were:
| 1. R326 million in June 2010. | 2. R550 million in December 2010. |
The operating performance of this cluster has been as follows since acquisition:
| R’000 | F2007 | F2008 | F2009 | F2010 | F2011 | F2012 | |||||||
| Revenue | 231 081 | 689 220 | 671 317 | 491 860 | 434 233 | 309 743 |
|||||||
| PBITˇ | 45 531 | 141 946 | 55 835 | 20 186 | (68 157) | (72 250) |
|||||||
| Operating margin (%) | 20 | 21 | 8 | 4 | – | – |
| ˇ | Profit before interest and taxation. |
The motivation for the acquisition of the quarry and readymix concrete businesses we acquired from F2007 was on the basis of a long term cycle of public infrastructure spend that was to include a number of phases of the Gauteng freeway projects, the expansion of Johannesburg to the East and West, as well as a buoyant residential and emerging social housing market. Our initial strategy when acquiring this business in terms of feeding materials into our construction operation remains relevant. However, a construction company running quarries is not optimal as we mainly draw for our own contracts, which does not provide the required volumes. However, in the hands of owners who are suppliers of finished product they can more easily absorb this in their manufacturing value chain. It would be even more costly for shareholders if the group waited for a market recovery before exiting the business. The board of directors of the group thus resolved in December 2011 to dispose of the businesses that constitute the Construction Materials cluster.
The group’s operating margin would have reduced to 2.9% from 3.8% had the cluster been recorded as continued operations.
| The group has concluded two disposals relating to this cluster subsequent to the decision to sell these assets. These were BGM and Bernoberg. |
At year end, an impairment to the carrying value of the Construction Materials cluster was recorded. The effect is as follows:
| R million | June 2010 (F2010) |
Dec 2010 (F2011) |
June 2012 (F2012) |
||||
| Gross impairment | 325,5 | 550,5 | 362,1 | ||||
| – Mining assets and undeveloped mining resources | 253,9 | 419,0 | 285,3 | ||||
| – Fixed assets | 71,6 | 106,7 | 76,8 | ||||
| – Goodwill | – | 24,8 | – | ||||
| Reducing earnings net of taxation by: | R293,1 | R521,6 | R340,8 |
Regarding the remaining assets within the Construction Materials cluster, the group is currently engaging with a number of parties who have made firm offers. These are under negotiation. The group expects these sales to be completed before December 2012.
The carrying value of this discontinued cluster at year end was as follows:
| R’000 | 2012 | ||
| Assets | |||
| Non-current assets | 155 794 | ||
| Current assets | 65 076 | ||
| Non-current assets classified as held for sale | 220 870 | ||
| Liabilities | |||
| Non-current liabilities | 20 160 | ||
| Current liabilities | 95 235 | ||
| Liabilities associated with non-current assets classified as held for sale | 115 395 | ||
| Net assets | 105 475 |
 |
Operational contract performance |
The group monitors its contract profit/loss-maker ratio both in value and in number of contracts. It is a ratio of loss-making versus profit-making active contracts with a profit or loss greater than R100 000 for the year. In addition, it monitors the value generated or absorbed (and the number of contracts to which this is associated) for:
|
||
|
These indicators are reported to the audit committee and the main board of directors on a quarterly basis at a group and business unit level.
| The group has concluded two disposals relating to this cluster subsequent to the decision to sell these assets. These were BGM and Bernoberg. |
During the year the group has seen a significant weakening in the contract profit/loss ratio with the single largest loss generated by the previously reported DISI pipeline contract in Jordan.
| Based on contract value | 2012 | 2011 | ||
| Profit-making contracts | 73% | 85% | ||
| Loss-making contracts | 27%* | 15% |
| ˇ | Including Middle East losses. |
| Excluding the contract losses incurred in the Middle East, the contract loss ratio for the Construction cluster is in line with that previously reported at 14%. |
 |
Financial impact of Middle East operations on the group’s results |
The group has operated in the Middle East since it established a presence in 2004. It has successfully operated with local joint venture partners in the United Arab Emirates (UAE) and in Jordan for the past few years. The joint venture partner relationships were developed based on the ability of the local partner to procure opportunities in the region, with the group being able to provide the technical skill.
The group was awarded material contracts since it arrived in the region and healthy contact margins were extracted in previous years. Unfortunately due to the financial crisis and the clients’ inability to fund the contracts to completion, two of the group’s contracts, DPF for the Engineers’ office (Meraas) and 470A&B for the Department of Civil Aviation (DCA), were terminated by the clients in January 2009. Since then the group has invested much time and effort, along with its joint venture partner in Dubai, in closing out these terminated contracts.
The group is pleased with the progress it has been able to make in the close out of these two terminated contracts.
| DPF – Engineers’ Office (Meraas) |
|
| 470A&B – Department of Civil Aviation (DCA) |
|
As reported previously, no adjustment to carrying value on these terminated contracts and their claims were required as the group had been conservative in its accounting. The only adjustment processed, as previously disclosed, was the “time value of money” discounting adjustments on DPF of R13 million as the group agreed to a payment plan of quarterly instalments over five years.
| The local UAE market is in a state of flux and in contract “close out” mode as clients struggle to finalise outstanding contract negotiations with contractors. Contractors are also struggling to manage their local operations with costs incurred and a limited ability to recover these timeously from clients. Negotiation timeframes are long and tedious, with many contractors reverting to arbitration and legal proceedings. |
During the last financial year the group was awarded a pipeline contract in Jordan which was not managed in accordance with the group’s standard policies and procedures and which incurred substantial costs. The group recorded a R111 million loss over the two financial years while it was under construction. This has been an expensive lesson.
The group continued to incur annual holding costs in the form of overheads to:
|
Although the local management team has always been confident of the full recovery of all contract claims and measure of works carried on each contract, effective and timeous closure on these contracts has become more difficult as:
|

The group’s focus in the year was on commercial close out and the final settlement of as many of these aged contracts as possible to improve its return, remove any “lazy” assets from the group’s balance sheet and free up executive management time. The group has been able achieve this. However, this has come at some cost to the current year’s performance.
Management believe that, similar to the process followed with the terminated contracts, where costs have been incurred in prior years it would be more optimal to negotiate a settlement. Although this potentially leads to some write off against income, it allows the group to finally settle claims, collect debtors and work in progress balances and free up the balance sheet more timeously. All contract positions taken have been agreed with our joint venture partners and through engagement with client representatives.
| Management have addressed each
remaining contract within the Middle
East operations and expect to be in a
position to achieve final completion
certification per contract – including
agreement on payment and cash flows
– in the F2013 financial year.
Management have accrued for all known probable costs. |
The two most material individual charges to the income statement with respect to the Middle East operations were:
| Current year loss on DISI Jordan pipeline | R76 million |
| Overheads | R40 million |
The net carrying value of the group’s Middle East assets and liabilities at 30 June are outlined in the table below:
| R’000 | 2012 |
| Trade and other receivables | 433 929 |
| Work in progress | 142 733 |
| Cash and cash equivalents | 60 379 |
| Net trade and other payables | (609 453) |
| Net asset value |  |
 The group does not expect
further credit or collection
risk exposures on these
balances. We believe we have taken the
necessary action to address this risk. The group does not expect
further credit or collection
risk exposures on these
balances. We believe we have taken the
necessary action to address this risk. |
| Inclusive of the contract losses recorded within this financial year, the group’s financial return in the Middle East “Life to Date” at a contract level is still positive. However, since F2010 the operations have not been able to sustain the level of overheads required due to decreased trading levels. Reduction of overhead costs have been a focus. However, the cost of trading in UAE is substantially higher than in any of the other regions in which the group operates. This has been compounded by the cost of commercial staff and support required. |
 |
Diversification strategy |
| The benefit of the group’s diversification strategy has come through as its annuity-type businesses of Infrastructure Concessions and Manufacturing were able to reduce the full effect of the current operating conditions. For example, the Investments and Concessions cluster contributed 46% of the group’s total operating profit compared to 18% in the prior year. |
Investments and Concessions’ operating profit consists of mainly:
|
In the current year the group recorded the following fair value adjustments:
|
The group’s operating margin percentage is stated including these fair value adjustments. Excluding these, the group’s operating margin would have been as follows:
| 2012 | 2011 | |||
| Total operating margin including fair value adjustments – % | 3.8 | 6.9 | ||
| Total operating margin excluding fair value adjustments – % | 3.0 | 6.3 |
The group’s investment in service concessions represents a material long term investment for the group. Its carrying value at year end was as follows:
| Name of road | Country | Km | % interest | Concession period | 2012 | 2011 | ||||||
| A1 (Phase II) | Poland | 61 | 15 | 30 years | 228 585 | 168 776 | ||||||
| A1 (Phase I) | Poland | 90 | 15 | 30 years | ||||||||
| M6 (Phase III) | Hungary | 78 | 10 | 28 years | 68 050 | 84 324 | ||||||
| Total | 296 635 | 253 100 |
Fair values of investments in projects still under construction are considered to be the cost of the investment. Fair values of investments in projects where the effects of significant unmitigated project risks cannot be estimated with certainty, the discounted cash flow method is used at appropriately high start-up phase risk premiums. Where investments in service concessions are denominated in a currency other than Rand, the investments are translated at year end spot rates.
The investments in the A1 phase I and II road projects in Poland and M6 phase III project in Hungary are valued by using the discounted cash flow method on the underlying project cash flows due to operations having commenced on all these projects.
A basic sensitivity analysis, calculating the effect on investment valuation from differing exchange rates on the fair value of investment in these service concessions, was performed at 30 June 2012. The effect, when varying Euro-Rand exchange rates by 10% on fair values of these investments, was R29,6 million (2011: R25 million). Similarly, every 10% increase or decrease in the discount rates used in the discounted cash flow basis of valuation results in a decrease or increase in the valuation of between R29,9 million to R35,2 million (2011: R18,7 million – R21,8 million).
 |
Cost management |
The group disclosed earlier in the year that its operating profit would be impacted by certain investment costs. These include:
 |
Growth costs | or capacity building to secure future growth opportunities for which no benefit would have been obtained in F2012. These include costs incurred in renewable energy submission bids, the establishment of the group’s nuclear business and in taking more of the group’s businesses into Africa |
|
Holding costs |
|
||||||||
In addition, as disclosed on page 63, the group reviewed its costs and implemented a “cost out” programme aimed at reducing costs based on projections of limited growth in the short term.
At the end of the F2011 financial year, it was clear to management that the group’s structural steel business was not a market in which the group should be operating. It incurred losses in the F2011 year and a decision was made to cease operations and close this business. Operational losses, retrenchment costs and closure costs totalling R11 million with respect to this steel business were incurred in the first half of this financial year.
The table below discloses the effect of the holding costs, growth costs, closure costs and retrenchments on the operating margin for the current year.
| % | Group | Investments and Concessions |
Manufacturing | Construction | Building and Housing |
Civil Engineering |
Engineering | |||||||
| Core operating profitˇ | 3.7 | 23.7 | 4.8 | 1.8 | 2.5 | (1.1) | 5.2 | |||||||
| Core operating profit* | 4.9 | 24.3 | 6.0 | 3.0 | 3.7 | 0.5 | 6.0 | |||||||
| ˇ | Excluding profit and losses on disposal of fixed assets. |
| ˇ | Adjusted for holding costs, growth costs, closure costs and retrenchment costs |
The group was also able to remove overheads in F2012 to contribute to the operational results for the year. Certain of these costs will have once off benefits, while others will have an annualised benefit going forward. The total overhead costs removed as part of our “costs out” programme totalled R112 million in the year. This had a 1.3% positive impact on the group operating margin. These savings offset the holding and growth costs incurred, which are discussed above.
 |
Driving growth |
| The group is conscious
that a leading indicator
of financial performance
for the coming year is the group’s
order book. For this reason the group
independently assures its secured
Construction order book to provide
stakeholders with a level of
confidence on this disclosure. It
remains the only local construction
company to do so. |
The group applies a conservative approach to its disclosure of the order book, as can be seen with its current and past treatment of awards. It only accounts for formally secured contracts.
|
|

The group’s Construction order book at year end is as follows:
| Construction | Building and Housing |
Civil Engineering |
Projects and E&CS |
||||||
| Total order book – R’million | 11 301 | 3 584 | 4 412 | 3 305 | |||||
| % over-border | 38% | 5% | 57% | 50% | |||||
| – Public over-border | 13% | – | 34% | – | |||||
| – Private over-border | 25% | 5% | 23% | 50% | |||||
| % local | 62% | 95% | 43% | 50% | |||||
| – Public local | 31% | 44% | 31% | 18% | |||||
| – Private local | 31% | 51% | 12% | 32% | |||||
| 1 year order book | 8 339 | 2 795 | 3 294 | 2 250 | |||||
| 1 year order book as % of F2012 revenue | 117% | 135% | 110% | 110% | |||||
| Total order book as % of F2012 revenue | 159% | 173% | 147% | 161% |
The group commences its financial year with an order book which is geographically diversified. (The strong focus on South Africa in the Building and Housing order book is due to the removal of an over-border contract which no longer meets the group’s definition of secured and due to recent local awards.) The group expects growth in its Construction revenue in F2013.
 |
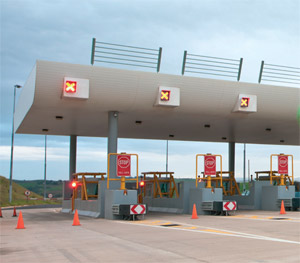
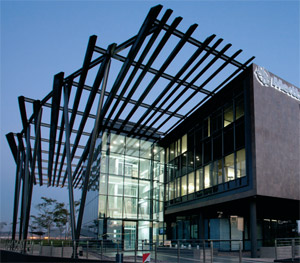
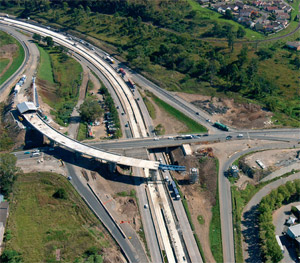
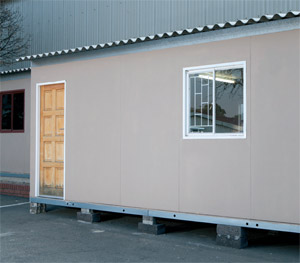
Margin expectations The group aims to deliver the following underlying operating margins by cluster and segment. |
 |
 |
 |
||
| Investments and Concessions |
Building and Housing |
Civil Engineering | ||
| 15 – 20% | 3 – 4% | 4 – 6% | ||
| Range, including fair value adjustments |
Range | Range | ||
 |
 |
 |
||
| Manufacturing | Projects | Engineering and Construction Services |
||
| 5 – 7% | 5 – 8% | 3 – 5% | ||
| Range | Range | Range |
The information contained in this section has not been reviewed or reported on by Group Five’s auditors.
 |
Balance sheet positioning and the group’s liquidity |
| 2012 | 2011 | |||
| Net asset value per share – R | 18,72 | 22,38 | ||
| Net debt to equity ratio | – | – | ||
| Cash on hand – R millions | 2 268 | 2 235 | ||
| Current ratio | 1.2 | 1.1 |
The weak trading performance and impairments in the year reduced the group’s net asset value per share from R22,38 to R18,72. The group’s non-current assets excluding non-current assets classified held for sale) decreased from R1,9 billion to R1,5 billion mainly as a result of a transfer of these assets to non-current assets held for sale.
The group’s liquidity position remains strong with:
|

The following table details the group’s remaining contractual maturities for its financial assets and liabilities and indicates that the group should have adequate liquidity to meet its existing financial commitments:
| R’000 | Within 1 – 6 months |
Within 7 – 12 months |
Within 1 – 2 years |
Within 2 – 5 years |
Greater than 5 year |
Total | ||||||
| Financial assets | 3 702 963 | 1 253 080 | 63 430 | 61 129 | 442 400 | 5 523 002 | ||||||
| Financial liabilities | 2 348 744 | 1 843 577 | 423 506 | 391 587 | – | 5 007 412 |
Bond issuance in terms of Domestic Medium Term Notes (DMTN) Programme
The JSE Limited granted a listing to the group in respect of two Senior Unsecured notes issued under the group’s R1 billion Domestic Medium Term Note Programme. Two unsecured bonds were issued on 11 April 2012 as follows:
|
The primary application of these funds is intended to finance equity investments in power, transport, real estate opportunities and concessions.
 |
Capital investment |
During the year there were no business combinations. Following the group’s experience in investing in the Construction Materials businesses, the group has refined its merger and acquisition methodology and evaluation processes. Although certain investments have been earnestly investigated over the last few years, these have been declined as sufficient comfort on the acquisitions could not be obtained.
During the year the group grew its product and geographic diversification organically. A relevant change within the year has been the increased level of expenditure on capital equipment, specifically in the rest of Africa in support of the group’s strategy of growth into the region and the infrastructure-related and capital intensive contracts won.
Expenditure is only incurred once approved by the group’s central treasury. It is based on pre-required levels of return which are a function of either the group’s weighted average cost of capital (WACC) – which was 12.2% in the year – or on the WACC based on the cost of new capital, as applicable. The central treasury funding requirements are raised from local debt markets and take into account the group’s self-imposed net gearing ratio of a maximum of 33%. The group’s current net gearing ratio is nil.
The group purchased the following fixed assets in the year:
| R’000 | 2012 | 2011 | |||||
| Investments and Concessions | 34 922 | 6 376 | |||||
| Manufacturing | 25 368 | 32 020 | |||||
| Construction | 278 632 | 96 340 | |||||
| Building and Housing | 2 638 | 3 745 | |||||
| Civil Engineering | 201 851 | 57 596 | |||||
| Engineering | 74 143 | 34 999 | |||||
| Total | 338 922 | 134 736* | |||||
It was allocated to the following regions:
| R’000 | 2012 | 2011 | |||||
 Eastern Europe Eastern Europe |
33 653 | 5 277 | |||||
 Middle East Middle East |
2 706 | 28 469 | |||||
 Eastern Africa Eastern Africa |
660 | – | |||||
 Southern Africa Southern Africa |
172 275 | 84 059* | |||||
 Central Africa Central Africa |
92 878 | 7 126 | |||||
 Western Africa Western Africa |
36 750 | 9 805 | |||||
| Total | 338 922 | 134 736* | |||||
The group’s total property, plant and equipment is allocated to the following regions:
| R’000 | 2012 | |||
| Eastern Europe |
47 858 | |||
| Middle East |
9 818 | |||
| Eastern Africa |
642 | |||
| Southern Africa |
659 409 | |||
| Central Africa |
98 906 | |||
| Western Africa |
67 734 | |||
| Total | 884 367 |
In F2013 the group has the following capital requirements (committed or authorised):
| R’000 | 2013 | |||||
| Investments and Concessions | 10 310 | |||||
| Manufacturing | 36 009 | |||||
| Construction | 347 271 | |||||
| Building and Housing | 20 982 | |||||
| Civil Engineering | 238 969 | |||||
| Engineering | 87 320 | |||||
| Total | 393 590 |
| * | Excludes Construction Materials capital expenditure of R15,6 million. |
 |
Achieving the required return on equity |
The group has a set target of 15 – 20% return on equity from continuing operations.
In the current year the group has not met its target, with a negative return on equity. This is as a result of losses from the Construction Materials cluster and operational losses from the Middle East.
With the actions taken in the current year, this should form a base from which growth and hence improved performance can take place.
The group provides the following voluntary disclosures:
| 2012 | ||||
| Group margin excluding Middle East losses – % | 6.1 | |||
| Headline earnings from continuing operations* – R per share | 1.78 | |||
| Headline earnings from continuing operations* – excluding Middle East losses – R per share | 3.87 | |||
| Group return on equity excluding Middle East losses~ – % | (3.7) | |||
| Group return on equity from continuing operations^ – % | 10.3 | |||
| Group return on equity from continuing operations before Middle East losses$# – % | 21.1 |
| * | Excludes operational losses generated by Construction Materials and India contract claim legal costs. |
| ~ | Adjusts group return on equity by Middle East losses for 2012. |
| ^ | Adjusts group return on equity by Construction Materials financial performance and financial position life to date and carrying value of India life to date. |
| $# | Adjusts return on equity from continuing operations by excluding Middle East losses. |
| Back to Group Five | © Copyright by Group Five. All rights reserved. | Back to top ^ |