 |
|
||||||||


for the year ended 30 June 2012
Segment information
Operating segments reflect the management structure of the group for the period under review and the manner in which performance is evaluated and resources allocated as managed by the group’s chief operating decision maker, defined as the executive committee members (exco) of the group.
These operating segments for the year under review are defined as:
| Operating segment | Revenue source | |||||||||||||||||||
 |
Investments and Concessions | |||||||||||||||||||
|
|
|||||||||||||||||||
 |
Manufacturing |
|
||||||||||||||||||
 |
Construction | |||||||||||||||||||
|
|
|||||||||||||||||||
The group is focused by discipline and each discipline is led by an executive committee member.
The role of exco is to drive the strategic intent of the group per segment. The executive committee members meet monthly to review the group’s performance. Of primary focus to exco is the revenue, operating profit, capital expenditure and current assets per segment. Exco assesses the performance of the operating segments based on a measure of adjusted operating profit. This measurement basis excludes the effects of non-operational income and expenditure from the operating segments such as pension fund valuation assets and deficits and profit or losses on sale of subsidiaries. Gains or losses on disposal of property, plant and equipment as well as investment property and fair value adjustments on service concessions, investment in property development and investment property are not adjusted as these are deemed to be in the segments’ core operational control. The operating profit does not include any impairment adjustments. As exco reviews operating profit the results of discontinued operations are not included in the measure of operating profit.
Management do not believe that there are any additional segments that require separate reporting.
The reportable operating segments derive their revenue as described above.
The group is also considered by geographical segment due to the extensive geographic footprint maintained by the group. The geographies are grouped into regions for reporting purposes as the group moves towards establishing operational hubs for management of regions.
The prior year comparatives have been restated to adjust for the exclusion of the construction material business now reflected as a discontinued operation and the inclusion of all fair value adjustments as these are deemed to be in the segments' core operational control.
The segmental information presented below includes the reconciliation of IFRS measures presented on the face of the income statement to non-IFRS measures which are used by management to analyse the group’s performance.
Financial performance: Group revenue and operating profit
|
||||||||
| Note: Graphs represent F2012 values only. |
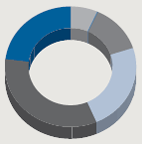
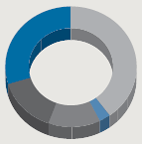
| 2012 | Gross revenue |
Internal revenue |
External revenue |
Operating profit |
||||||||
| R’000 | ||||||||||||
| Operational segments | ||||||||||||
| Investments and Concessions | 647 739 | – | 647 739 | 153 795 | ||||||||
 Infrastructure Concessions Infrastructure Concessions |
619 915 | – | 619 915 | 143 708 | ||||||||
 Property Developments Property Developments |
27 824 | – | 27 824 | 10 087 | ||||||||
 Manufacturing Manufacturing |
1 164 849 | (140 520) | 1 024 329 | 46 490 | ||||||||
| Construction | 7 204 326 | (93 016) | 7 111 310 | 121 315 | ||||||||
| Building and Housing |
2 139 449 | (73 477) | 2 065 972 | 52 133 | ||||||||
| Civil Engineering |
2 998 800 | (1 053) | 2 997 747 | (37 541) | ||||||||
| Engineering |
2 066 077 | (18 486) | 2 047 591 | 106 723 | ||||||||
| 9 016 914 | (233 536) | 8 783 378 | 321 600 | |||||||||
| Adjustment for non-operational items | ||||||||||||
| Pension fund valuation surplus | 15 790 | |||||||||||
| Impairment of investment in associate – Investments and Concessions | (1 399) | |||||||||||
| Remeasurement of employment obligation | (4 593) | |||||||||||
| Operating profit per income statement | 331 398 | |||||||||||
| 2011 Restated | Gross revenue |
Internal revenue |
External revenue |
Operating profit |
||||||||
| R’000 | ||||||||||||
| Operational segments | ||||||||||||
| Investments and Concessions | 554 659 | – | 554 659 | 110 774 | ||||||||
| Infrastructure Concessions |
522 870 | – | 522 870 | 105 641 | ||||||||
| Property Developments |
31 789 | – | 31 789 | 5 133 | ||||||||
| Manufacturing |
997 375 | (129 852) | 867 523 | 25 547 | ||||||||
| Construction | 7 404 220 | (53 637) | 7 350 583 | 471 536 | ||||||||
| Building and Housing |
2 174 074 | (31 070) | 2 143 004 | 134 506 | ||||||||
| Civil Engineering |
3 550 849 | (2 488) | 3 548 361 | 227 723 | ||||||||
| Engineering |
1 679 297 | (20 079) | 1 659 218 | 109 307 | ||||||||
| 8 956 254 | (183 489) | 8 772 765 | 607 857 | |||||||||
| Adjustment for non-operational items | ||||||||||||
| Pension fund valuation deficit | (2 000) | |||||||||||
| Loss on disposal of subsidiary | (299) | |||||||||||
| Operating profit per income statement | 605 558 | |||||||||||
Sales between segments are carried out at arm’s length and are reflected above.
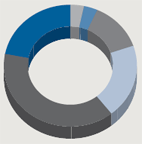
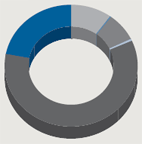
Financial position: Current assets and capital expenditure
|
||||||||
| Note: Graphs represent F2012 values only. |
| Operational segments (R’000) | 2012 | 2011 | 2012 | 2011 | ||||||||
| Investments and Concessions | 234 850 | 231 280 | 34 922 | 6 376 | ||||||||
| Infrastructure Concessions |
118 916 | 147 205 | 34 820 | 6 081 | ||||||||
| Property Developments |
115 934 | 84 075 | 102 | 295 | ||||||||
| Manufacturing |
459 931 | 402 767 | 25 368 | 32 020 | ||||||||
 Construction Materials Construction Materials |
– | 168 731 | – | 15 616 | ||||||||
| Construction | 2 803 249 | 2 760 195 | 278 632 | 96 340 | ||||||||
| Building and Housing |
689 507 | 650 514 | 2 638 | 3 745 | ||||||||
| Civil Engineering |
1 352 077 | 1 649 477 | 201 851 | 57 596 | ||||||||
| Engineering |
761 665 | 460 204 | 74 143 | 34 999 | ||||||||
| 3 498 030 | 3 562 973 | 338 922 | 150 352 | |||||||||
| Bank balances and cash | 2 268 226 | 2 234 779 | – | – | ||||||||
| Total current assets per statement of financial position | 5 776 256 | 5 797 752 | ||||||||||
| Property, plant and equipment – additions | 338 922 | 150 352 | ||||||||||
The measures of current assets and capital expenditure have been disclosed for each reportable segment as these are regularly provided to exco.
Geographic information
South Africa is regarded as the group’s country of domicile. As described, the various geographies are monitored via operational hubs and thus disclosed as such below.
|
||||
| Note: Graphs represent F2012 values only. |
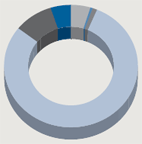
| Geographical regions (R’000) | 2012 | Restated 2011 |
||||||
| Eastern Europe |
433 948 | 300 358 | ||||||
 Middle East Middle East |
43 805 | 405 211 | ||||||
| Eastern Africa |
85 986 | 25 550 | ||||||
| Southern Africa |
6 962 809 | 6 782 019 | ||||||
 Central Africa Central Africa |
830 197 | 1 030 594 | ||||||
| Western Africa |
426 633 | 229 033 | ||||||
| 8 783 378 | 8 772 765 | |||||||
| Per income statement | 8 783 378 | 8 772 765 | ||||||
| Back to Group Five | © Copyright by Group Five. All rights reserved. | Back to top ^ |